Introduction
High Signal is a breadth measure. It identifies symbols that satisfy several scanner conditions at the same time; it is not a recommendation system. This analysis examines whether greater scanner agreement is associated with different subsequent return distributions and how to make that comparison when the scanner universe changes over time.
A raw count such as 4+ is easy to understand but not stable by itself. Four matches out of twenty eligible scanners is a different breadth signal from four matches out of thirty. Adding or retiring scanners can change the count without changing the symbol or its market conditions.
The normalized measure used in this report is defined as:
agreement_rate = matched_scanners / eligible_active_scanners
matched_scanners is the number of active scanners that match a symbol. eligible_active_scanners is the total scanner universe that was eligible to produce a match at that time. The denominator is historical: a scan run should use the scanner set active on its own date, not today’s catalog.
For the current catalog used by this report, there are 23 eligible active scanners. That makes the present-day equivalents below useful for reading the raw thresholds:
| Raw matches | Current agreement rate |
|---|---|
| 2+ | 8.7%+ |
| 3+ | 13.0%+ |
| 4+ | 17.4%+ |
These are current translations, not historical rate measurements. If the eligible scanner universe was smaller or larger on an event date, the same raw count represented a different agreement rate. The historical results below therefore retain their raw thresholds until versioned scanner-universe snapshots are available.
The percentages also should not be interpreted as interchangeable evidence. Changing scanner conditions, thresholds, filters, or eligibility rules can change both the match counts and the resulting performance distributions. The identity of the agreeing scanners matters as well: five overlapping technical scans may represent a different signal from five independent scans spanning price, fundamentals, valuation, and ownership.
Historical event method
The available historical series records three raw thresholds: 2+, 3+, and 4+ simultaneous matches. For each threshold, an event begins on the first day a symbol’s total scanner matches rise into that threshold from below. For example, a 4+ event begins when the symbol reaches four or more simultaneous matches, not when it enters or leaves one particular scanner. Higher thresholds are excluded because their completed samples are too small for stable comparison. The entry price is the next available trading close on or after the event date. Forward returns are measured over 30-day, 90-day, 180-day, 1-year, and 2-year windows.
These are raw stock returns rather than benchmark-relative returns. A symbol may contribute more than one event to a given threshold if its total match count falls below that threshold and later crosses back above it.1 The dataset contains all available observations through 2026-10-05; longer holding periods have fewer completed observations because recent events have not matured.
What the historical counts show
Across the displayed thresholds, greater scanner agreement was associated with stronger subsequent performance. The pattern is visible across both return distributions and positive-outcome rates. Higher thresholds are omitted because their samples are too sparse for stable comparison.
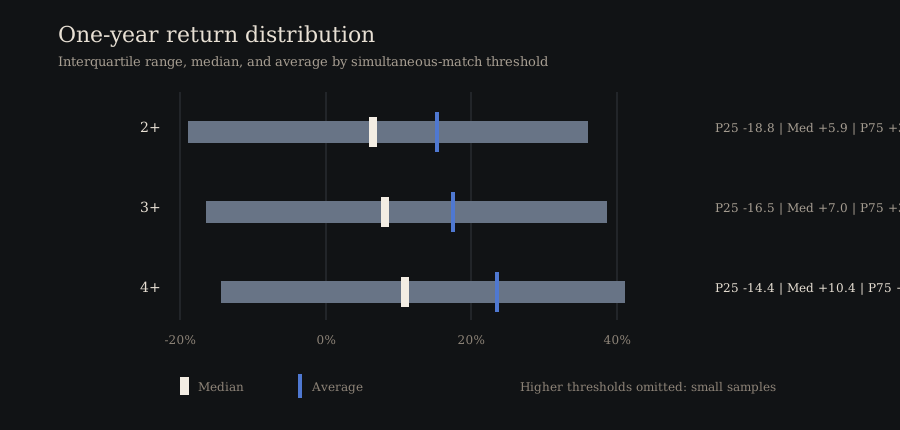
One-year performance summary
| Threshold | Agreement rate (current) | Episodes | Avg | Median | Win | P25 | P75 |
|---|---|---|---|---|---|---|---|
| 2+ | 8.7%+ |
36,252 | +15.14% |
+5.92% |
56.2% |
-18.84% |
+36.08% |
| 3+ | 13.0%+ |
7,346 | +17.38% |
+7.01% |
58.1% |
-16.45% |
+38.45% |
| 4+ | 17.4%+ |
1,106 | +23.50% |
+10.35% |
60.5% |
-14.42% |
+41.11% |
Differences are small at shorter horizons and larger at one and two years:
| Threshold | Agreement rate (current) | 30D | 90D | 180D | 1Y | 2Y |
|---|---|---|---|---|---|---|
| 2+ | 8.7%+ |
+0.70% |
+2.24% |
+4.03% |
+5.92% |
+4.99% |
| 3+ | 13.0%+ |
+0.80% |
+2.54% |
+5.04% |
+7.01% |
+6.30% |
| 4+ | 17.4%+ |
+1.07% |
+2.81% |
+4.25% |
+10.35% |
+10.85% |
Within the displayed range, the pattern is consistent with greater breadth identifying a slower-moving condition rather than an immediate price event, but the data does not establish that mechanism or show that any threshold causes the subsequent returns.
Limitations
- Returns are raw, not benchmark-relative, so they do not isolate performance beyond market or sector exposure.
- This is an observational analysis: events begin when total matches cross a threshold, entries are not randomized, and the same symbol may contribute repeated, potentially dependent events.
- Completed sample sizes decline at longer horizons. Thresholds above
4+are omitted because their completed samples are too sparse for stable comparison. The historical and current universes may differ, creating possible survivorship and membership bias.2
- Scanner conditions may be correlated or conceptually overlapping, so simultaneous matches should not be treated as independent votes.
- A normalized rate is only as reliable as the historical scanner-universe snapshot behind its denominator.
Reading the signal
The conclusion is modest: in this dataset, greater simultaneous scanner agreement on a stock is associated with stronger subsequent outcomes. That is the north star for Aurex’s custom and prebuilt scanners: to refine them so they surface high-quality investment ideas consistently over time.
This is the role of Aurex: to elevate stronger ideas for further examination by making multiple forms of evidence visible together. Scanner agreement can help prioritize research, but it is only one lens among many. Market regime, business quality, valuation, liquidity, timing, scanner overlap, and countless other variables still shape the outcome.
For comparisons across time, the durable unit is not a fixed raw count. It is the combination of matched scanners, eligible scanners, universe version, and scanner logic. Keeping those fields with every observation makes it possible to distinguish a real change in signal breadth from a change in the scanner set itself.